Every council in England is required to calculate a number: how many homes it needs to plan for each year. That number is produced by a formula called the standard method. It determines whether a council can refuse a planning application, whether a Local Plan will pass examination, whether developers can build on sites the community never chose. If you care about what gets built near where you live, this is the number that matters.
The old formula.
The previous standard method, introduced in 2018 and revised in 2023, worked in four steps. Step one took the ONS 2014-based household projections and calculated annual household growth. Step two applied an affordability adjustment: for every 1% the house-price-to-earnings ratio exceeded 4, the baseline rose by 0.25%, capped at a 40% increase. Step three applied a further cap linked to the adopted Local Plan requirement. Step four added a 35% uplift for the 20 largest cities.
Under the December 2023 NPPF, this calculation was described as an "advisory starting point." Councils could depart from it. Protected landscapes, flood risk, infrastructure constraints: all were legitimate reasons to argue for a lower figure.
The national total came to roughly 305,000 homes per year.
The new formula.
On 12 December 2024, the government replaced all of that.
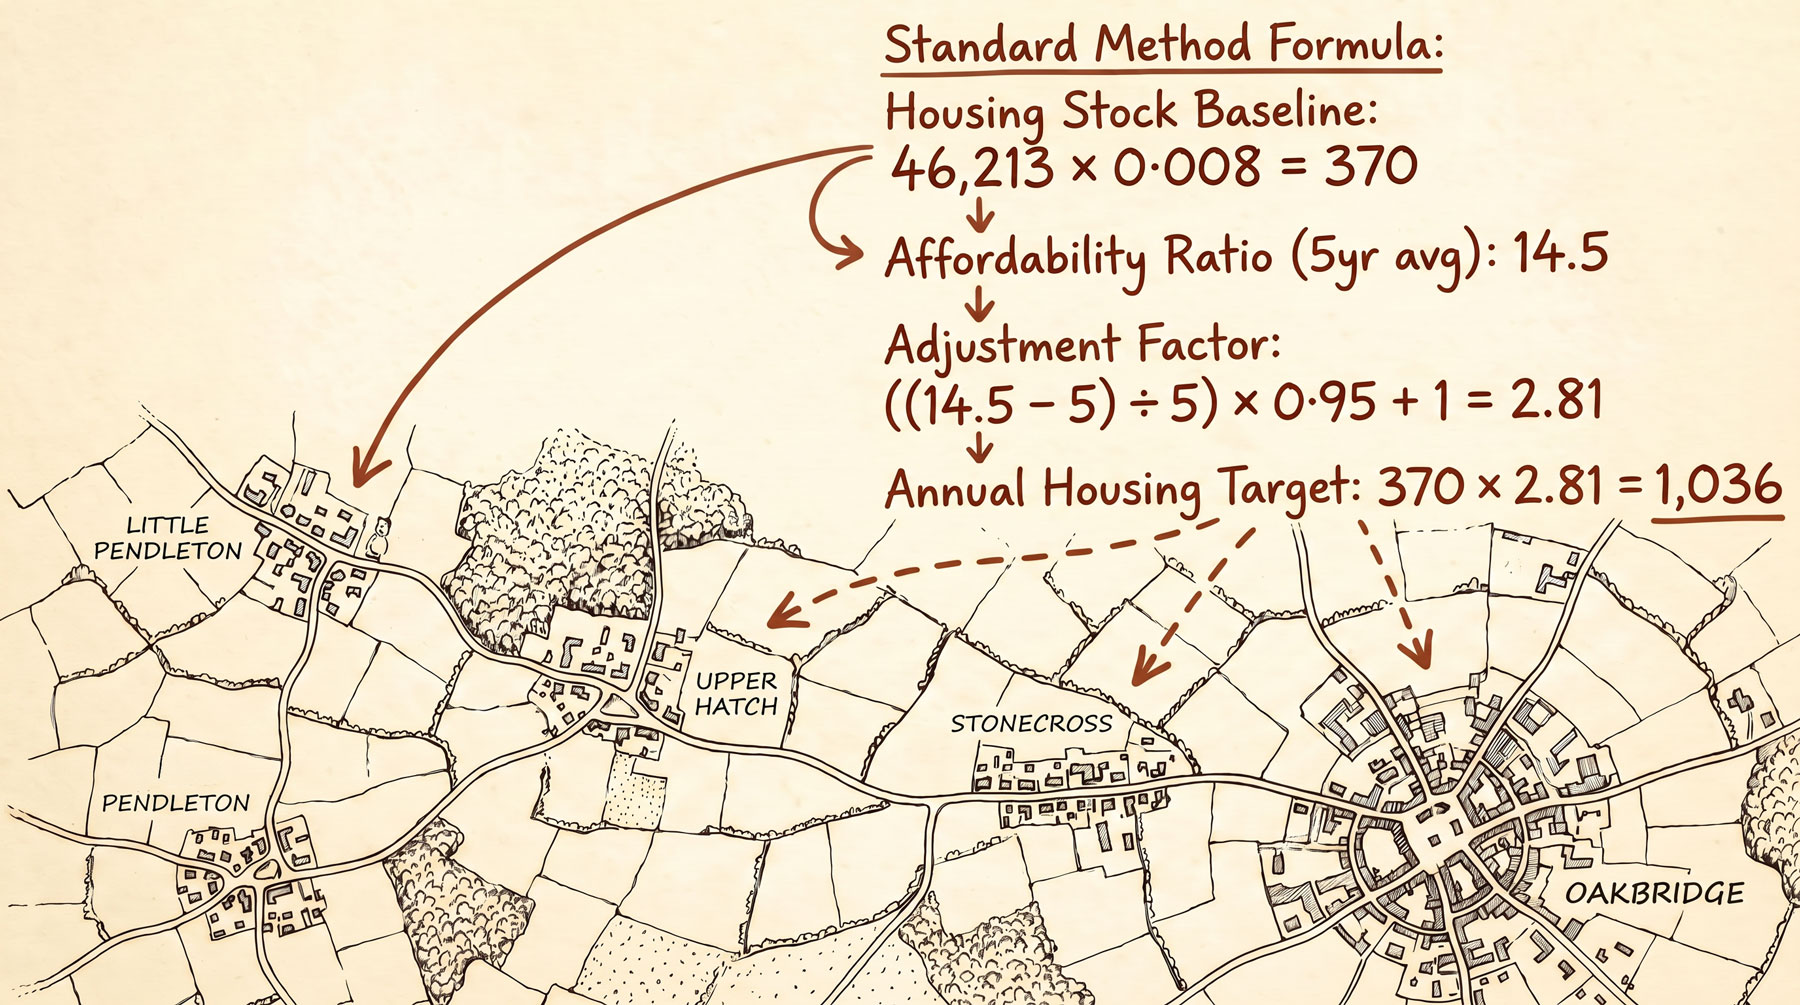
Step one now takes 0.8% of the existing housing stock, as recorded in MHCLG's dwelling stock estimates. Not projected household growth. Not how many new households are expected to form. Just the current stock, multiplied by 0.008. A district with 46,213 dwellings gets a baseline of 370.
Step two applies an affordability adjustment using the five-year average ratio of median house prices to median workplace-based earnings. The formula is:
Adjustment factor = ((average affordability ratio − 5) / 5) × 0.95 + 1
The final target is: baseline × adjustment factor.
That 0.95 replaced the old 0.25. Nearly four times more aggressive. An area that previously received a 30% uplift now receives roughly 72%.
Three other things changed at the same time. The 40% cap on the affordability adjustment was removed entirely, meaning there is no upper limit on how much the formula can inflate a target. The 35% urban uplift for the 20 largest cities was scrapped, shifting pressure from cities to rural and suburban areas. London's figure fell from 99,800 to 88,000. And the formula was made mandatory. The "advisory starting point" language is gone. So is the exceptional circumstances clause. A council can no longer argue that its National Landscape or National Park or flood plain justifies a lower number.
The national total rose to approximately 371,000 homes per year. A 21% increase.
The December 2025 draft NPPF, which was consulted on until March 2026, proposes reintroducing a cap at 4.0 times the baseline and embedding the formula directly into the framework itself rather than in separate planning guidance. The government's response has not yet been published. The finalised NPPF is expected by summer 2026, most likely July based on the timeline of previous consultations.
Get the dispatch.
Long-form, data-first, independent. Housing, planning and infrastructure reporting delivered free to your inbox.
What this looks like in practice.
Take Cotswold District: 46,213 dwellings (MHCLG Table 125, March 2023). Multiply by 0.008. Baseline: 370.
The ONS five-year average median affordability ratio for the district is 14.56 (ONS, Housing Affordability in England and Wales, 2025). Plug that into the formula: adjustment factor of 2.82. Multiply by the baseline of 370. The result: 1,036 homes per year. An uplift of 180% on the baseline. The adopted Local Plan, from 2018, set a requirement of 420. The new figure is a 147% increase.
The pattern repeats across the country. East Hampshire's target nearly doubled to 1,142. Forest of Dean's jumped to 600. Wherever house prices are high relative to local earnings, the formula produces a number far above anything the area has delivered before, and in many cases far above anything it could physically deliver given its constraints. The formula does not check whether delivery is possible. It simply sets the number.
What follows from the number.
Three consequences flow from the standard method figure, and they are what give it real power.
If a council's Local Plan does not plan for at least this many homes, it will almost certainly be found unsound at examination. The plan fails. Years of work, consultation and community engagement collapse.
If a council cannot demonstrate a five-year supply of deliverable housing sites against this number, the "tilted balance" applies: a presumption in favour of granting planning permission, even on sites the plan never allocated. Developers file on those sites, cite the shortfall and win at appeal. The council loses control of where development happens.
If a council delivers fewer than 85% of this number over three years, as measured by the Housing Delivery Test, a 20% buffer is added to the supply requirement, making the hole deeper. If delivery falls below 75%, the presumption in favour kicks in again, the same tilted balance triggered by the five-year supply shortfall, but now through a second route.
In practical terms, the standard method is the number that determines whether a council controls development in its area or whether developers do.
What the formula does not measure.
The standard method is not an assessment of how many homes an area actually needs. It does not count the number of people on housing waiting lists, model demographic change, track migration or project population growth. Since December 2024 it does not even use household projections. It takes the existing stock and applies a formula driven by house prices and earnings. That is all.
It has no awareness of physical constraints. The formula does not know that 80% of the Cotswolds is National Landscape, that 57% of East Hampshire sits inside a National Park, or that a district's sewage treatment works are already at capacity. It generates the same kind of output for a constrained rural district surrounded by protected landscape as it does for an unconstrained town on the edge of a motorway.
It does not distinguish between types of demand. The affordability ratio measures the gap between local house prices and local workplace earnings. But the ONS itself acknowledges the limitations: 60% of mortgages are based on joint income, yet the formula uses individual earnings. The self-employed are excluded entirely. And the ONS notes that areas with high proportions of commuters show the largest gap between what workers earn and what residents earn (ONS, Housing Affordability in England and Wales: 2025). In expensive rural areas, many of the people buying homes do not work locally. They commute from cities, or they are retired, or they are buying second homes. In the Cotswolds, Savills data shows almost half of buyers relocated from London. The formula reads that purchasing power as local housing need and converts it into a higher target. It does not ask who is buying or why.
And it does not measure whether building more homes will actually improve affordability. If demand is driven by external equity rather than local household formation, new supply gets absorbed by the same buyers who made the area expensive in the first place. Prices stay high. The affordability ratio stays high. The formula keeps generating the same inflated target. The circularity is not a bug. It is the design.
One technical distinction worth understanding: the standard method produces a minimum "local housing need" figure. The "housing requirement" is the number that goes into the Local Plan after considering constraints and evidence. In theory, the requirement can be lower than the need figure. In practice, since December 2024, it cannot. Any plan that proposes a lower number will be found unsound. The distinction still exists on paper. It has ceased to exist in reality.
The formula prevents councils from building less. It does not prevent anyone from demanding more.— The Editor · Ground Level, April 2026
The formula also sets a floor, not a ceiling. Councils cannot go below the number. But developers can argue the true need is higher, and inspectors can agree. The formula prevents councils from building less. It does not prevent anyone from demanding more.
371,000.
The standard method produces a number for every local planning authority in England. Added together: 371,000 homes per year. The government's stated target is 300,000, or 1.5 million over the parliament. The formula deliberately overshoots on the assumption that not all planned homes will be delivered.
Whether either number reflects genuine housing need is a question for a later piece in this series. What matters here is simpler. The standard method is a formula with two inputs and a mandatory minimum that cannot be argued down. It does not measure most of the things people assume it measures: whether the homes can physically be built, whether local people will be able to afford them, or whether building them will make any difference to the problem they are supposed to solve.